


As a data scientist, understanding evaluation metrics is crucial to building and assessing effective machine learning models. Among all the metrics, the ROC Curve (Receiver Operating Characteristic Curve) is a powerful visualization tool for classification models. In this article, I’ll take you through a detailed guide to the ROC curve.
A Guide to ROC Curve for Data Scientists
In this guide, we will explore the key components of the ROC curve, what it reveals about machine learning models, and how to interpret the AUC (Area Under the Curve) score effectively.
Key Components of the ROC Curve

The ROC curve plots the True Positive Rate (TPR) against the False Positive Rate (FPR) across various threshold values. Let’s break down its components to fully grasp its utility.
- True Positive Rate (TPR): This metric, also known as sensitivity or recall, measures the proportion of actual positives that are correctly identified.
- False Positive Rate (FPR): This metric measures the proportion of actual negatives that are incorrectly classified as positives.
- Thresholds: Classification models use a decision threshold to determine class labels. Adjusting this threshold affects both TPR and FPR, leading to different points on the ROC curve. A low threshold favours higher TPR (recall) but increases FPR, while a high threshold reduces FPR but may lower TPR.
- Area Under the Curve (AUC): The AUC summarizes the ROC curve into a single scalar value. It represents the likelihood that the model will rank a randomly chosen positive instance higher than a randomly chosen negative one. The closer the AUC is to 1, the better the model’s performance.
- Perfect vs. Random Models: A perfect model will have a curve that hugs the top-left corner, indicating high TPR and low FPR. A random model will produce a diagonal line from (0, 0) to (1, 1), showing no discriminatory power.
What ROC Tells About a Machine Learning Model
The ROC curve provides insights into the trade-offs between sensitivity and specificity at different thresholds. Here are some crucial takeaways.
As shown in the graph below, a curve closer to the top-left corner indicates a model with high sensitivity and minimal false positives, while a diagonal line (FPR = TPR) suggests a model that performs no better than random guessing.
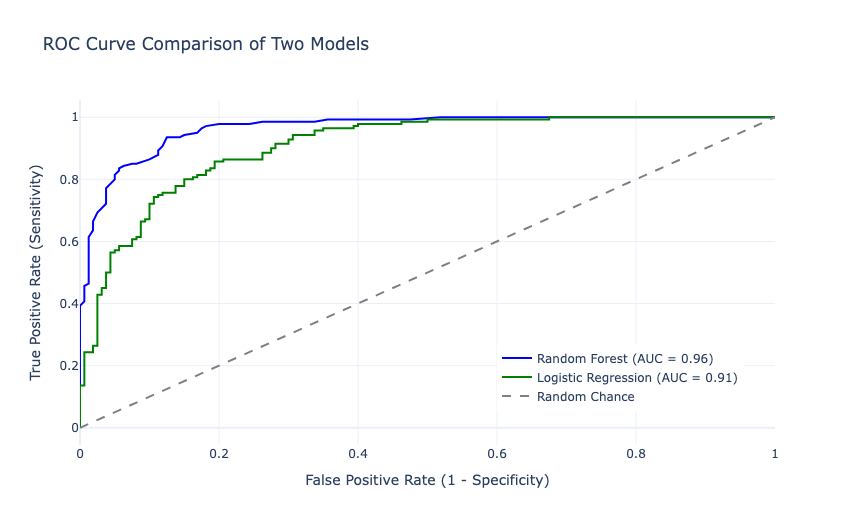
ROC curves are also invaluable for comparing multiple models. As shown above, a model with a curve consistently above another model’s curve is generally superior in terms of classification performance.
How Much AUC Score Is Enough
The Area Under the Curve (AUC) is a single scalar value that quantifies the ROC curve’s performance. Here’s what AUC scores tell you:
- Excellent Model (AUC ≥ 0.9): The model has a high ability to distinguish between positive and negative classes.
- Good Model (0.8 ≤ AUC < 0.9): Reliable performance but might need further tuning or feature engineering.
- Acceptable Model (0.7 ≤ AUC < 0.8): Could work for initial iterations but requires improvement for critical applications.
- Random Guess (AUC ≈ 0.5): Indicates the model has no discrimination capability.
Summary
Here are some key takeaways from this guide to ROC Curve:
- ROC Curve: Visualizes trade-offs between sensitivity (TPR) and specificity (1-FPR) across thresholds.
- AUC Score: Summarizes model performance; higher AUC indicates better discrimination.
- Threshold Impact: Adjusting thresholds changes TPR and FPR, enabling flexibility.
- Model Comparison: Curves closer to the top-left corner signify superior models.
- AUC Ranges: AUC ≥ 0.9 is excellent; AUC ≈ 0.5 suggests random guessing.
I hope you liked this article on a guide to ROC curve for Data Scientists. Feel free to ask valuable questions in the comments section below. You can follow me on Instagram for many more resources.


